Welcome to the IdeaMatt blog!

My rebooted blog on tech, creative ideas, digital citizenship, and life as an experiment.

Wednesday
Feb182015

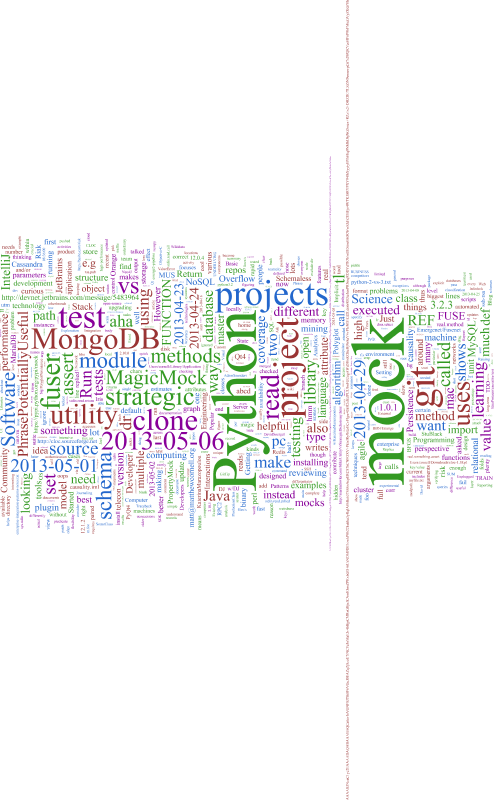
Using word clouds to get a birds eye view of a large professional programmer's notebook

(Image couresy of Theen Moy.)

tl;dr: Running a word cloud program on a multi-year professional log is entertaining and useful for a quick understanding of past projects.

Background: My Big-Arse Text File

In 2005 I wrote My Big-Arse Text File - a Poor Man's Wiki+Blog+PIM where I described the simple setup I use for keeping my professional ProgrammersNotebook, something I've been doing for decades. (If you're a programmer and don't keep one, I suggest you experiment with it. You don't have to go old school Emacs like I did - there exist wonderful tools like Evernote.) This practice has been undeniably helpful, especially when combined with using separate outline files for individual projects, and it facilitates my using the journal to:

  • Understand where I've been spending my time, including meetings (I use CamelCase to name people and projects, like GraphxEvaluation),
  • track the lifespan of individual projects,
  • appreciate just how much work I've done,
  • record code snippets,
  • log sites/algorithms/programs/tools that are exciting or that might be useful,
  • capture ideas (of course!),
  • save great quotes [1] I come across,
  • record account information (be careful of security, though), and especially
  • provide a master index to other project files (done simply by naming the file or by inserting a faux hypertext link where I put the relevant text in square brackets, e.g., "see [analyze log of failed graphx 5-step path]")

I find that all of this (including Emacs tools like Occur), combined with Mac OS X's Spotlight, is effective.

The problem: Getting a birds eye view

In preparing for a projects meeting with my boss, I needed to look over the file to get a birds eye view of the last 3 1/2 years. But I wasn't able to get a higher-level perspective of the 2500 entries in 40K lines of text. So I tried out an idea: Would creating a tag cloud on the file help to identify useful patterns? I found the answer is yes; in a just few minutes it can remind you of what you worked on. The only consideration was that a single word cloud for the whole file wasn't useful. I found I had to split the file into chunks to get the right temporal granularity, with 1000-line splits (basically monthly pieces) being about right.

Examples

Here are a few examples, followed by the steps I took to generate them.

#1 - A few main projects

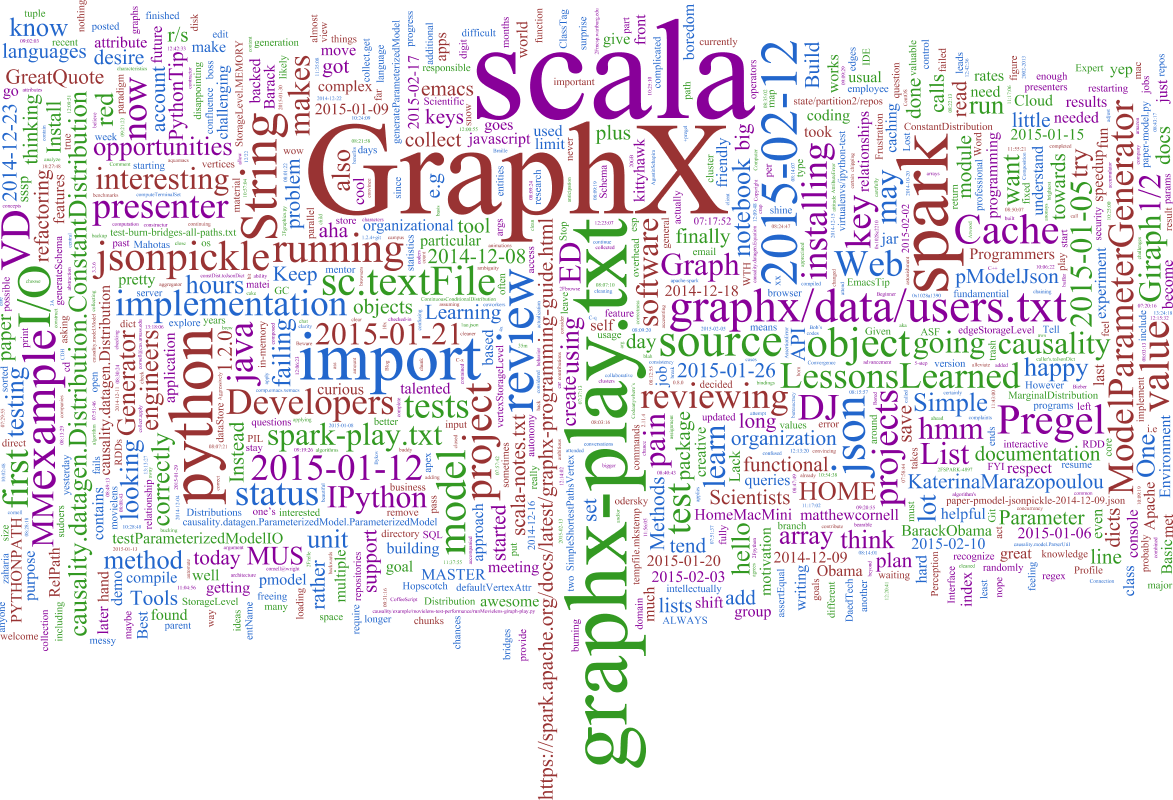
Yep - I've been evaluating GraphX with its Scala API for performance on a essential path-based algorithm the lab needs. (I'll share results in a future post.) Two months earlier you'd see basically the same pattern, but with Giraph and its outline text file as the focus (yes, The Apache Software Foundation is amazing) with Giraph, Vertica, and Impala before that.

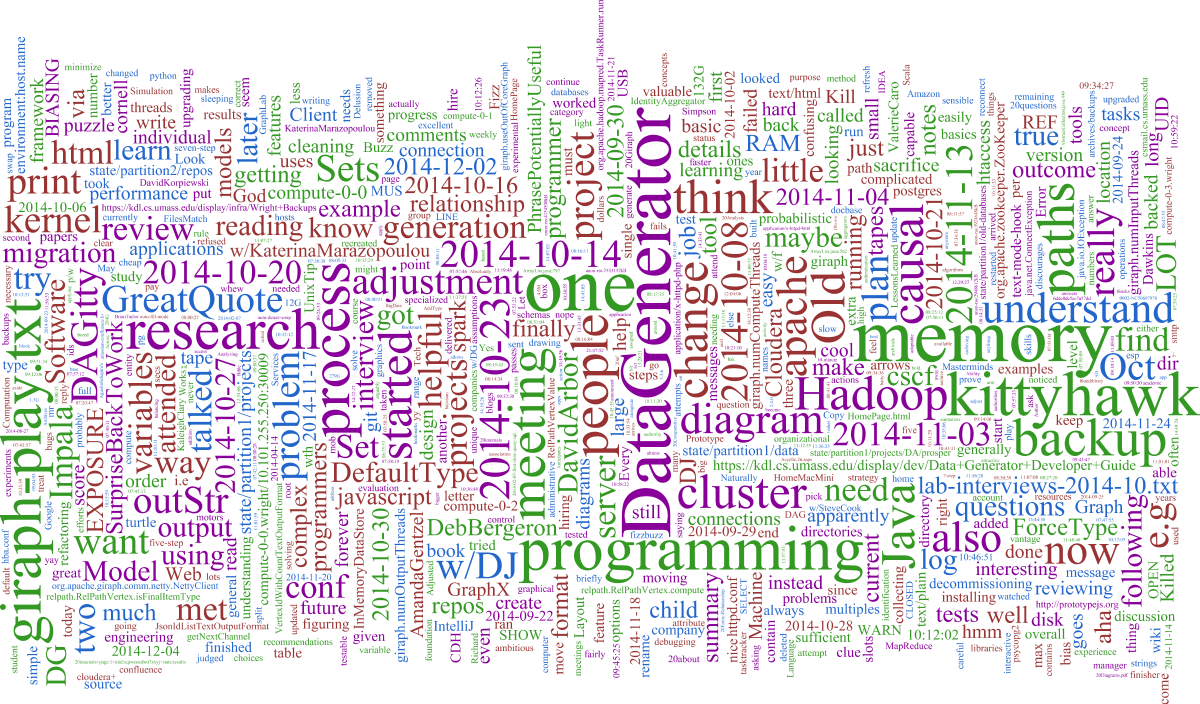
#2 - Mixture of projects

This one shows a time that was a little more diverse, including a relational data generator tool and some cluster https://en.wikipedia.org/wiki/Computer_cluster improvements.

#3 - A single giant focus

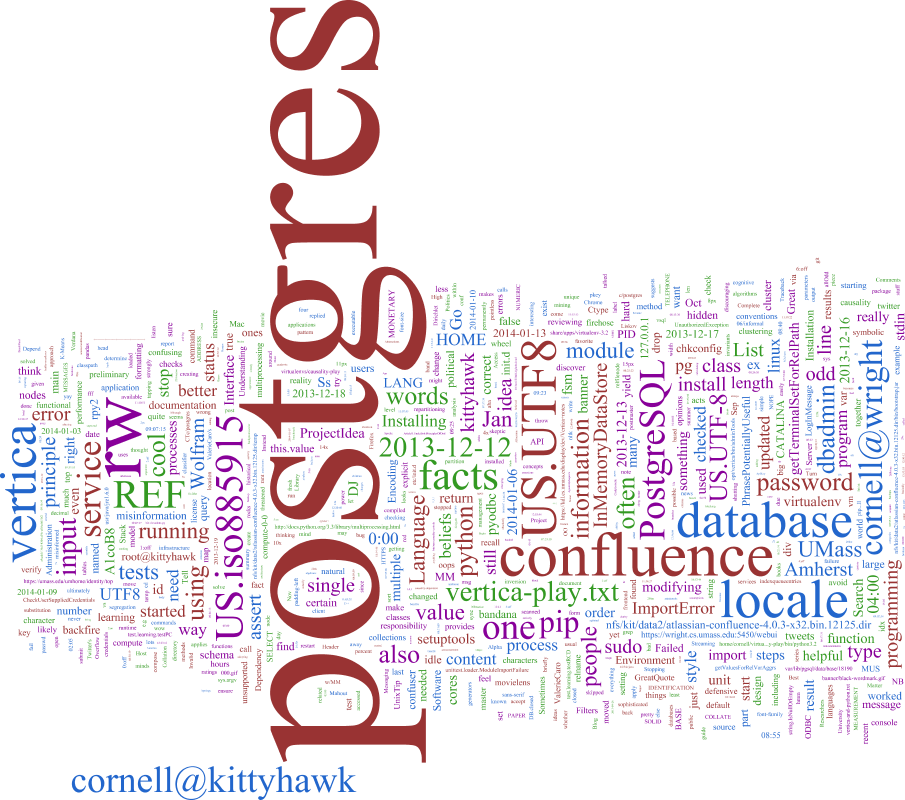
I really like Postgres, which has been our go-to SQL RDBMS for some time. During this time period I was writing an SQL data store for our "causal database."
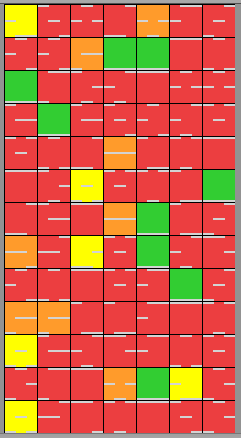
#4 - Layout issues

Python development with TDD (it's how I write code - XP rocks). Obviously the layout was skewed by a single very long line - maybe from some program's output log. The text is too small to read, so I couldn't add it to the stop words file below. Unfortunately the program I used doesn't seem to have a line limit feature.

Process

Generating these was straightforward once I found a workable tool, which took about two minutes of searching. I didn't want to use an online one (Wordle is popular) for privacy reasons, but fortunately IBM Word Cloud Generator fit the bill. It's a Java program with reasonable arguments and a config file. I ran split to get the chunks then ran the jar in a Bash for loop, and that's it. All I had to do was create a stop words file to remove some distracting ones ("system", "new", "INFO", etc.)

What do you think? Have you had to examine your log file for projects? Cheers!

[1] A few quotes

"When you're a student, you're judged by how well you answer questions. But in life, you're judged by how good your questions are." The art of entrepreneurship

(Regarding Heinlein's quote, "Specialization is for insects.") "[companies currently] hire people specialized to know some very narrow system. They want them to come running out of the box. [disappointingly] They want to cast them aside when they’re done. [instead] We need people who can think and change and learn what they need to learn." Masterminds of Programming: Conversations with the Creators of Major Programming Languages (Amazon link).

"Then he told me, very tenderly, that it can be dangerous to believe things just because you want them to be true. You can get tricked if you don’t question yourself and others, especially people in a position of authority. He told me that anything that’s truly real can stand up to scrutiny." Lessons of Immortality and Mortality From My Father, Carl Sagan

There are a ton of thought-provoking programming quotes here, such as these (which are not jokes):

  • When in doubt, use brute force.
  • The most effective debugging tool is still careful thought, coupled with judiciously placed print statements.
  • The essence of XML is this: the problem it solves is not hard, and it does not solve the problem well.
  • Nobody should start to undertake a large project .. start small, and think about the details. Don't think about some big picture and fancy design. If it doesn't solve some fairly immediate need, it's almost certainly over-designed.
Wednesday
Feb182015

Announcing PeepWeather.com! The at-a-glance weather forecast for outdoor enthusiasts.

Forecast for I'm very pleased to announce that my outdoor weather "at a glance" site is now live at peepweather.com. Yay! Now it's virtually real. I added a little branding (the chick header with the word "Peep" in yellow - marketing breakthroughs, both) plus some more features (the embeddable widget is on the right) but basically the site is feature-complete. The next step is sharing it with folks who would like to use it.

Getting the word out is the more difficult aspect of the project for me. Writing it was hard in its own way, but I'm very comfortable with technical work. Marketing, on the other hand, feels nebulous and daunting. Because the app is widely applicable for outdoor enthusiasts, my current thinking is to break potential audiences down into types of outdoor activities that I then reach out to individually. For example, sports (running, bicycling, hunting), motorcycling, etc. Basically any group of people who love being outside and want to know when it will be nice, hour by hour. The only activities that would not be a good match are those that require specific condition information, such as skiing (snow conditions) or surfing (water, tides, etc.) SEO is also important, but it's hard for me to know where to start.

That said, 1) the site is written, 2) my initial users say it's novel (!) and definitely useful, and 3) I'm quite pleased with how it turned out. Onward!

Tuesday
Jan272015

An RC Weather site update, plus a micro visual language

I continue to greatly enjoy developing my simple "at a glance" weather app for outdoor activities. Currently it's located at the default Heroku development domain rc-weather.herokuapp.com, but I should probably register a domain and get things configured to use it (feedback has been positive). The first thing I love about this project is the simple joy of writing a web application. I've barely dabbled with the fundamentals in the past, but it feels like I'm getting in touch with my Internet geek heritage. HTML, CSS, a little JavaScript, web frameworks - all tasty and relatively straightforward, modulo the quirks that come from the web's organic development.

My first prototype was in Groovy and Grails, mainly because I wanted to explore that language and framework, but it was soon apparent that they were overkill for this app, which has no data model at all! So I switched to Python, a language I'm fairly comfortable with from work, and Flask for the back end. What a breath of fresh air! I continue to enjoy Python for all the usual reasons (dynamic typing, interactive shell for exploring, huge inbuilt and third party library, etc.), and Flask's model is so clean - simply annotated routes, practical templating, useful plugins, and an included development server that makes a sweet web "REPL" workflow - save files and then reload the browser page.

Other tools

Heroku's hosting is pretty slick. Once you figure out the basics (Procfiles, requirements.txt, runtime.txt for Python 3, and of course the ever-painful Git), updating the site is just a 'git push heroku master'. Of course this app is dead simple (no database), but Python + Flask on Heroku is productive.

Templates: I'm using the included Jinja2 templates, which work fine so far. The MVC is clean (routes include objects as keywords in their returned renderers) and the features are adequate so far.

Style: So far I've been focusing strictly on functionality, so the site looks like a vanilla HTML one, but I'm excited to learn Twitter's Bootstrap for the front end. I'll likely use JQuery for interactive features, and some kind of UI library. I'm intrigued by D3 , though it's more of a nail looking for a hammer (if that strained metaphor makes any sense). Basically it's cool and I want to use it for something :-)

And the basics: The awesome IntelliJ IDEA, Aquamacs (Emacs familiarity is from my NASA AI and Symbolics days early in the Shuttle program), the Mac OS X Terminal, and Firefox with its yummy developer tools.

Collaboration

I tend to be a lone wolf, but I realize that it leads to major limitations in finished products. So it's been gratifying and productive to get help from a few sources, including a small group at the HeliFreak forums (the active post is here), my brother and fellow programmer Dave, and a few colleagues here and there.

Challenges

Really, there are only two non-technical intellectual challenges that I see: 1) the function that computes an hour's color based on the weather parameters (probability of precipitation, wind, apparent temperature, and soon cloud cover), and 2) how to indicate visually this information in an weekly calendar format.

For number one, right now it's a simple three step process (summary and ASCII Vision (TM) here): Give each parameter a low/medium/high desirability rating based on ranges, combine them into one of four hourly ratings (poor, fair, okay, or great) using simple logic based on counts, and map each directly to a color (CSS). I need to change the second function to handle a fourth parameter (cloud cover), and add support for weighting the parameters somehow. It's clear from the forums that customizing these is important because personal preferences vary. Right now I have a form for editing ranges, but sliders are appealing, esp. if they update dynamically the colors.

Number two is more interesting. How does one show each hour's overall rating along with information about the individual parameters' contributions without cluttering the display? I think it's correct to call this a micro visual language, one that has to convey "How good is that hour and why do you say that?" My initial idea was a weekly grid of colored squares like this:


An obvious approach is keeping the square empty except for color, and supporting an interactive exploration of each, say by having an information panel that shows detail for the hour that the mouse is over. But I'm resolute about putting all information in each cell because I don't want to have to search to understand the overall picture. This will be probably be more mobile-friendly too.

I played with adding unlabeled small bars at the bottom of each square, but relying on position to indicate the parameter was confusing. I suppose I could have used a graphics editor to create the prototype, but I programmed a random selection of squares using of Pillow ("the 'friendly' Python Imaging Library fork"). Here's the one I did:


My present solution - not especially novel - is to place icons representing the troublesome parameter inside of each square. Finding good ones is a challenge, but I think my 0.1 icons from erikflowers.github.io/weather-icons are, in Alan Kay's, "good enough to criticize" *:

Can you intuit the icons' meanings? Here's the key:


Personal value of the project

The primary value to me of this coding experience is the creative act of bringing an idea into (virtual) reality, an idea that ideally provides something of value to people. As an engineer at heart, making useful artifacts is what I thrive on, and this is a tiny expression of that. It's is bringing some meaning to my life outside of work, which is welcome.

Anyway, I'd love your thoughts and ideas on any of this.

Cheers!

Sunday
Dec072014

Using Grails to Make a Simple RC Weather App

I've been flying remote control helicopters (the acrobatic collective pitch ones, not 'drones') for over three years now, and I still get a lot out of the hobby. Recently I had an idea for a simple site/app that lets outdoor hobbiest get an at-a-glance view of how good the hourly weather looks for the extended forecast in their neck of the woods, and I've decided to implement this using Grails (with its somewhat steep learning curve). Another group at UMass uses it, and this app idea seems like a good candidate for learning Grails. I hope to blog a bit about the process, so here goes.

Goal: Show a summary of weather conditions for particular US zip code that quickly indicates the desirability of outdoor flying conditions in the next ~seven days. Along with the zip code, input would include (or default to) minimum temperature (optionally factoring in wind chill - say 40 °F), maximum wind speed (say 8 MPH), maximum precipitation potential (say 10%), and darkness.

User Interface: I haven't given much though to the UI, but maybe I'll start with a simple table of days on the x-axis, hours on the y, and cells that contain a visual encoding of the hour. This might be a simple "stoplight" red, yellow, and green, or something more exciting like Chernoff faces (via Edward Tufte). Hovering or clicking might show details.

Similar apps/sites: I was surprised that I didn't find many similar apps after a moderately-serious search. Weather Wardrobe demonstrates the basic idea for the current forecast (enter zip code, get an purpose-specific summary, how to dress appropriately in their case (e.g., "If you are in 01002, you should wear a heavy jacket over long sleeves and pants. Put on a hat and gloves.") I like it. The other is an iOS app called Windsock that's sophisticated but that is unavailable. It looks like they've nailed the concept, though.

This app may not be broadly exciting, but it'll be a fun excuse to learn Grails and maybe provide something of value to the hobby.

(Image credit: Discussing the Weather by Hartwig HKD)

Sunday
Dec072014

Returning to my IdeaMatt Roots

With this post I'm back to blogging, at least a little. :-) My nascent plan is to go back to my "IdeaMatt" roots and widen the topics to include technical posts (I've been working in a UMass research lab for the last three+ years), atheist/skeptic/rational thinking, and maybe some Experiment-Drive Life/Think, Try, Learn ideas. Generally I'm still enthusiastic about ways to use our brains to be happier, better people and Earthlings.